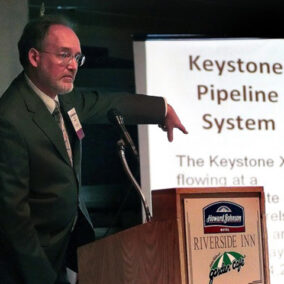
The Keystone Pipeline Is A Lemon. It Just Leaked Again for the 22nd Time
Share this Page
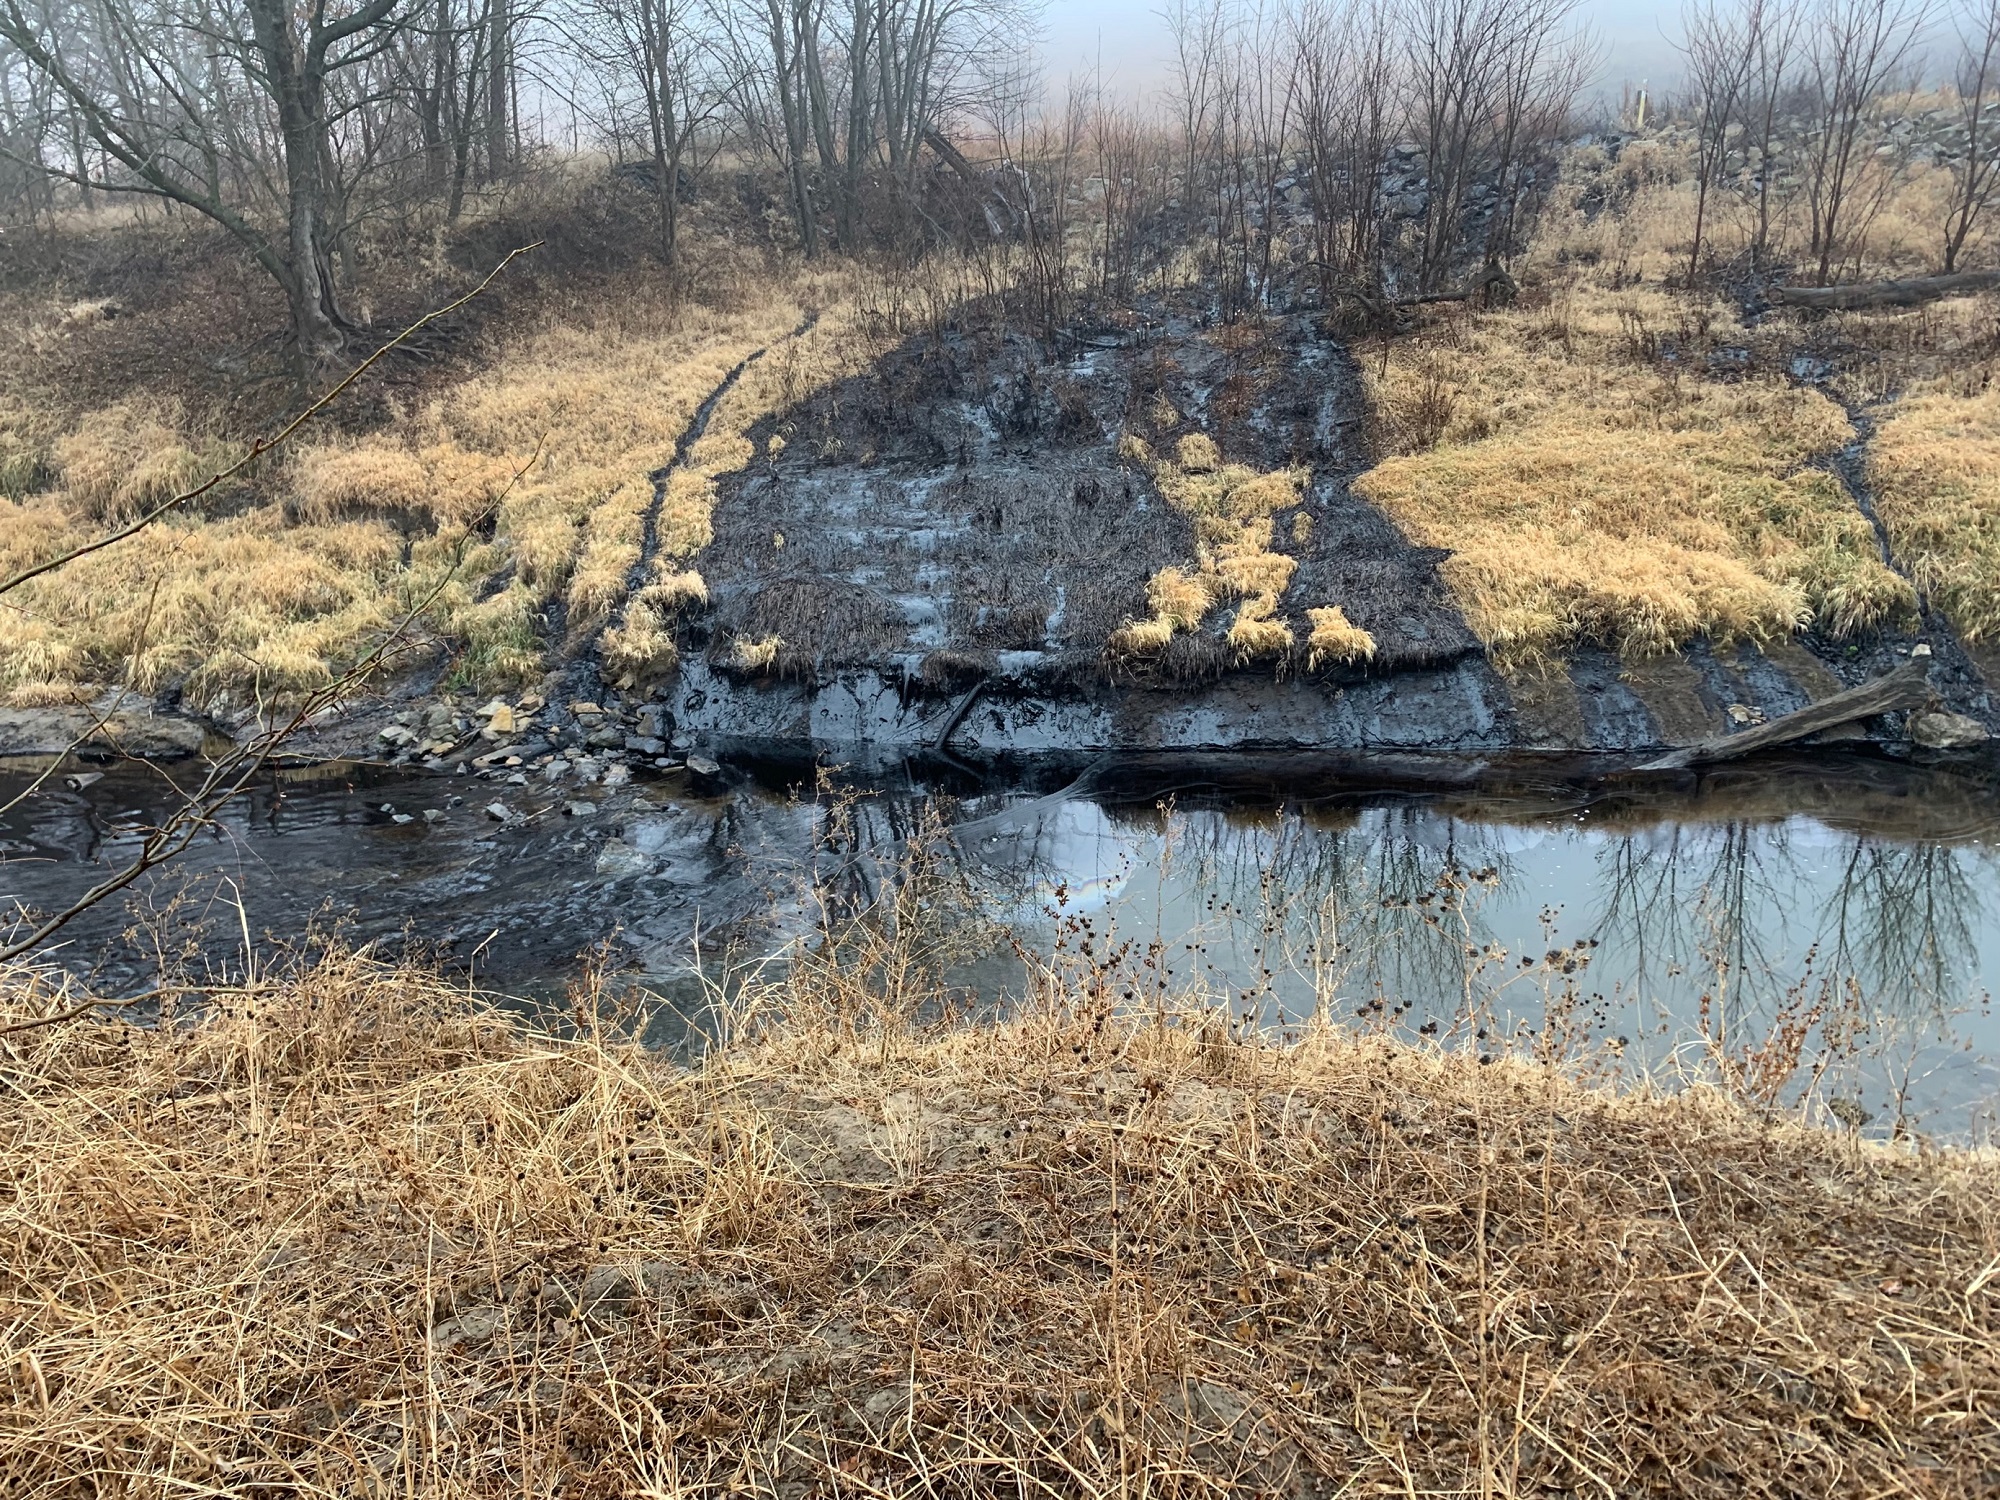
Site of TC Energy Keystone pipeline spill into Mill Creek near Washington, KS on Dec. 7, 2022 (Photo: U.S. EPA)
 The ill-fated Keystone Pipeline has spilled yet again. On December 7, the pipeline leaked near Washington, Kansas, resulting in a spill of at least 14,000 barrels – over 500,000 gallons – of tarsands, benzene and other unknown chemicals into nearby land and waterways, the largest US oil spill in nearly a decade. It’s worth understanding, in part because it serves as a cautionary tale for carbon pipeline development.
This isn’t the first time the Keystone pipeline has spilled. Since it began operation in 2010, there have been twenty-two leaks and ruptures (for a full list click here).
The Keystone Pipeline is a lemon. This blog identifies some of the factors that contributed to its past spills, as well as some new factors possibly related to the December 7 spill.
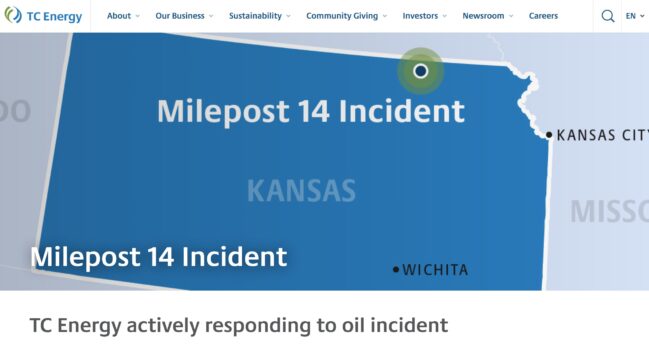
Photo: TC Energy
Right now, the authorities don’t know what caused this particular disaster. Although PHMSA has issued a Corrective Action Order (CAO) for the Washington spill, it doesn’t yet know what caused the spill. The CAO’s purpose is to officially require TC Energy, the owner of the Keystone Pipeline, to figure out what went wrong, fix the pipeline, and report back to PHMSA. The CAO’s “corrective actions” are generic ones that are sent to any pipeline that spills oil. For example, the CAO requires that TC Energy remove the busted pipe segment and send it to a laboratory for close examination and forensic testing.
Interestingly, the CAO states that TC Energy was running an in-line inspection (ILI or smart PIG) at the time of the rupture, and that this tool was south of the rupture site. An ILI is sort of like an ultrasound, NMR or CAT scan for a pipeline. Assuming the tool was being run with the flow of the oil, this suggests that TC Energy may have very recent ILI data on the pipe segment that burst.
Generally speaking, pipeline ruptures and other disasters are caused by a combination of factors. While official reports may identify a primary cause, such as a defective weld, the defect could be caused by a combination of underlying reasons, such as rushed work, inadequate training, defective materials, etc. The forensic analysis of pipeline failures is a well-established science, so hopefully, PHMSA will look more deeply than the direct technical cause.
Bad Steel, Rushed Construction, Flooded Trenches
TC Energy was originally named TransCanada. The Keystone Pipeline was TransCanada’s first major crude oil pipeline development project. It was in a race with Enbridge to provide pipeline capacity to export tar sands oil from Canada to the US. TC Energy and Enbridge were competing for a share of a limited market. TC Energy started construction on the Keystone Pipeline in 2009 and it came online in the spring of 2010, just months before Enbridge brought its new Alberta Clipper Pipeline into service.
At the time that TC Energy bought its pipe, it faced stiff competition for pipe steel due to soaring demand for new pipelines by the fracked natural gas and tar sands industries, as well as overseas demand. The steel and pipe fabrication industries were rushing to meet this demand. When a number of brand-new natural gas pipelines ruptured during their initial pressure tests, PHMSA investigated the cause of these ruptures and discovered that a number of pipe suppliers had supplied defective steel. One of the primary sources of defective steel was a company named Welspun. It also provided steel pipe for the Keystone Pipeline. PHMSA ultimately required TransCanada to replace some of the pipe segments in the Keystone Pipeline. For a full history of the defective steel issue, check out my 2010 report on this issue.
In part due to higher-than-expected steel prices, competition for labor and materials, and perhaps management errors and inexperience in oil pipeline development, the Keystone Pipeline construction project suffered from a 145% cost overrun for its Canadian portion, and a 92% cost overrun for its US portion. Some of TransCanada’s customers, including Coffeyville Resources Refining & Marketing, LLC, the National Cooperative Refinery Association, and Sinclair Oil Corporation, were not best pleased and sued TransCanada in a Canadian court to void their long-term contracts, because the projected costs to use the Keystone Pipeline were much more than expected. It seems likely that during construction TransCanada knew about the cost overruns and may have been cutting corners to save money. The cost overruns were not caused by permitting delay, because the Keystone Pipeline was one of the first tar sands pipelines and was permitted and under construction before significant opposition to pipelines developed.
As a result of pressure to complete construction and keep costs down, TransCanada constructed the pipeline during a very wet summer. Eastern South Dakota looked like one big swamp, and as a result TransCanada’s construction contractors were often working in very wet conditions. Much of the pipe was laid in trenches flooded with water, to the point that TransCanada needed to weigh down the pipe with cement “saddles” in many locations to make the pipe sink to the bottom of the trench. This “saddling” contributed to at least one rupture.
In addition, before construction even started, PHMSA waived a safety regulation and issued a “Special Permit” that authorized the Keystone Pipeline to operate at higher than normal pressures. PHMSA’s hazardous liquid pipeline safety regulations limit pipeline pressure to 72% (a design factor of 0.72) of the “minimum yield strength” of the steel pipe. The Special Permit authorizes TransCanada to operate the Keystone Pipeline at up to 80% of minimum yield strength – a lower margin of safety.
Are any of the foregoing factors underlying causes for the December 7 rupture? Hard to say, but it’s possible. Defective materials, poor construction, rushed work, cost cutting, and challenging construction conditions can result in hidden defects that may cause failures decades after construction, particularly if a pipeline is pushed to its limits.
Squeezing a Lemon
Recently, TC Energy announced that it was conducting a test in November and December of this year to increase throughput on the Keystone Pipeline from 610,000 bpd to 720,000 bpd. The original capacity of the pipeline was 590,000 bpd. So, TC Energy has increased capacity by a total of 22%. Reported actual throughput data by the Canadian Energy Regulatory (CER) and the U.S. Federal Energy Regulatory Commission (FERC) is generally 4 months behind, but the most recent CER monthly data, reported on September 1, indicates that TC Energy shipped an average of 639,170 bpd in August. FERC requires only quarterly data, so it’s not as useful. Nonetheless, what data we have indicates that TC Energy has been pushing the envelope.
Although the company has not described how it plans to increase capacity, it is possible that it is injecting a substance called “drag reducing agent” (DRA) into the pipeline, but it may also have modified its pumps and other equipment to support a higher flow. The chemical composition of DRA is generally a trade secret.
While the potential stresses caused by increased throughput are not known, it seems reasonable to investigate whether this experiment could have contributed to the Washington, Kansas failure. Perhaps TransCanada was trying to make lemonade, and instead made a mess.
Stormy Weather
On November 15, TC Energy reported that it had to slowdown throughput due to severe weather-related impacts. While it seems unlikely that this damage happened in Kansas, it is also true that severe weather is increasing geotechnical risks to pipelines. That is, cycles of very high rainfall and drought can destabilize soils and cause landslides, deepen riverbed scouring, and create other hazards that exert dangerous forces on pipelines.
Lowballing the Spill
TC Energy’s preliminary estimated oil spill amount is 14,000 barrels. In comparison, Enbridge’s $1.2 billion Kalamazoo spill amount was about 20,000 barrels. But, pipeline companies always lowball their estimated spill amounts.
Using public information, it is not difficult to estimate the spill amount at any location along a pipeline. The formula for estimating a worst-case spill size used by TC Energy in its emergency response planning is the amount of oil pumped out before pumps and valves are turned off (pumping rate volume) PLUS the amount of oil that drains out due gravity (line volume). This is the standard formula used to estimate worst-case discharges for all petroleum pipelines.
The maximum pumping rate volume is easy enough to calculate, because it requires knowing the daily or annual pumping rate (barrels per day or per year), converting this to barrels per minute, and then multiplying this by the number of minutes it took to shut off the pumps and close valves.
Understanding capacity is a bit tricky, because the capacity figures used in the press refer to the average annual capacity, meaning the capacity of the pipeline taking into account downtime over the course of a year for maintenance, repairs, operational inefficiencies, etc. In contrast, the daily capacity of a pipeline assumes uninterrupted pumping for 24 hours at maximum throughput.
The original average annual capacity for the Keystone Pipeline was 590,000 bpd with a maximum daily capacity of 662,400 bpd (from TransCanada’s 2009 emergency response plan). This equates to 460 barrels per minute. Now we know that TC Energy intended to try to transport up to 720,000 bpd during last month and this month, which would equate to 500 barrels per minute.
The OCA states that the release was detected at 9:01 PM and TC Energy started closing the valves at 9:08, so the pipeline kept pumping oil for about 7 minutes. This means that the pumping rate volume was, at most, likely somewhere between 3,220 and 3,500 barrels. If TC Energy was pumping at a reduced rate, this volume could be less.
Estimating the line volume amount is less precise, because it depends on the topography near a release site. If a release happened at the bottom of a wide valley with consistent slopes downward, and assuming there are no valves to block the oil, then essentially all of the oil in the valley would drain out of the pipe. In contrast, if a release happened at the top of the highest hill for miles around, likely almost no oil would drain out, because oil drains downhill. On the other hand, if the topography has multiple hills and valleys, some of the oil will drain out, but some will remain in low spots in the pipeline.
Using Google Earth, it is possible to see the topography of the pipeline route upstream and downstream of the spill site, that is the ups and downs of the pipeline. The PHMSA CAO says the approximate location of the spill was at these coordinates: 39°50’33”N 96 °59’44”W (to see this location on a map, copy these numbers into Google Earth or Google Maps). The right-of-way for the Keystone Pipeline can be seen on Google Earth or Maps, as well. Creating a path in Google Earth shows that oil could drain to the spill site from as far away as 6 miles to the north and about 5.5 miles to the south, meaning that a total of 11.5 miles, or about 60,000 feet of pipe could drain out. There do not appear to be any valves in the pipeline in this area. However, there are a number of hills along the route that could trap some of the oil. In its 2009 emergency response plan, TransCanada assumed as a general rule that 60% of the oil would drain out.
The amount of oil in the pipeline can be estimated from its radius and length. Here, the pipeline is 36 inches in diameter, meaning a radius of 18 inches or 1.5 feet. The formula is: πr2 * length * 0.60 = 3.14 * 1.5 ft * 1.5 ft * 60,000 ft * 0.60 = ~ 254,000 cubic feet, which converts to about 45,000 barrels of oil.
The final worst case estimate adds in the pumping rate volume, here estimated to be at least 3,000 barrels, making the total worst-case discharge estimate at this location of about 48,000 barrels.
Does this mean that this is the likely amount spilled? No, because TC Energy could have been pumping at a lower rate, more than 60% of the oil could have been trapped by low areas in the pipeline, or I might have missed seeing some valves nearer the rupture site, or due to some other factor.
This being said, don’t be surprised if TC Energy increases its estimated loss substantially above its initial estimate of 14,000 barrels.
The Rest of the Story
We won’t know the rest of the story for months. It will take time for the busted pipe to be removed, inspected and tested, and for PHMSA to release information about the cause. That being said, it’s likely that TC Energy already has a pretty good understanding of what went wrong, but due to liability concerns it won’t say anything in public.
The point of this blog is to highlight that many factors may contribute to failures, which is one of the reasons they are so difficult to prevent. The universe is constantly figuring out new ways to challenge humans, with the result that no pipeline is perfectly safe. Moreover, it is critical to consider not just the immediate causes of ruptures, but also all of the background factors that contribute to accidents, such as lack of experience, commercial pressures, competition for labor and material resources, new technology, increased project scale, product variations, etc.
While the chance of a pipeline failing at any particular location is quite low, the fact is that pipelines do fail and harm people and the environment. If a pipeline is built, it should be routed with an understanding that pipeline ruptures cannot be entirely prevented, such that routes should avoid families, vulnerable communities (such as nursing homes), businesses, and geohazards. Moreover, pipelines should be built to the highest possible safety standards without being rushed to completion by inexperienced developers.
The Keystone Pipeline release saga provides a cautionary tale for the proposed tsunami of carbon pipelines. There is a risk that the tens of thousands of miles of proposed new carbon pipelines will be rushed to completion by inexperienced companies, in competition with each other for scarce labor and materials, regardless of working conditions, on routes chosen to minimize cost – all to rake in obscenely generous federal tax credits – thereby laying a foundation for a follow-on wave of carbon pipeline ruptures that harm or even kill the humans and animals living near them.
All that being said, the safest pipeline is one that is never built.
12/8/22 PHMSA Corrective Action Order for TC Energy Keystone Pipeline:
TC Oil CAO.3-2022-074